Quantcast
Channel: ComponentSource News | Infragistics Ultimate UI for WPF
Viewing all 73 articles
Browse latest View live

Infragistics Ultimate UI for WPF 21.1

$
0
0
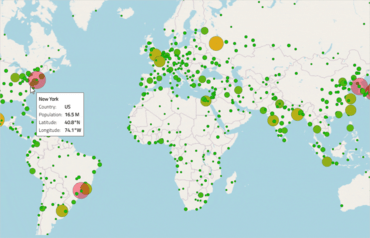
Geospatial Map

Updates design-time support in Visual Studio 2019 and improves Chart and Map controls.

Features

  • Improves design-time support in Microsoft Visual Studio 2019.
  • Chart Updates
    • Orientation on ItemLegend.
    • LegendHighlightingMode for Hover/Click.
    • PlotAreaMargin <Top, Bottom, Left, Right>.
    • Added support to configure highlighting at the level of the chart rather than the individual series.
    • Compressed X-Axis labelling for the TimeXAxis and OrdinalTimeXAxis.
    • Automatically sync the vertical zoom to the series content.
    • Added support for Annotation Layers to Stacked, Scatter, Polar, Radial and Shape series.
    • Added support for highlighting to Stacked, Scatter, Polar, Radial and Shape series.
    • Added HighlightingMode for all series types.
    • Added SeriesHighlightingBehavior.
    • Added support for overriding the data source of individual stack fragments within a stacked series.
    • Added support for automatically expanding the horizontal margins of the chart based on the initial labels displayed.
    • Added support for the custom style events to Stacked, Scatter, Range, Polar, Radial, and Shape series.
    • All series with markers have a property called MarkerFillOpacity.
    • All series with markers have a property called MarkerOutlineMode.
  • Chart Defaults
    • All types of charts/series have new colors for brush/fill and outlines.
    • All types of charts/series have marker outlines with 2px thickness.
    • All types of charts/series with markers have colored marker fill instead of white fill.
    • Bar/Column/Waterfall series have outlines with 1px thickness (other series have 2px thickness).
    • Bar/Column/Waterfall series have square corners instead of rounded corners.
    • Point/Bubble/ScatterSeries/PolarScatter series have markers with 70% transparent fill.
    • Point/Bubble/ScatterSeries/PolarScatter series have markers with solid outline that matches marker fill.
    • Other series (e.g. LineSeries/ScatterLineSeries) have markers with white outlines.
    • Scatter High Density series has new colors for min/max heat properties.
    • Financial/Waterfall series have new colors for negative fill of their visuals.
  • Geospatial Map Updates
    • Support for wrap around display of the map (scroll infinitely horizontally).
    • Support for shifting display of some map series while wrapping around the coordinate origin.
    • Support for highlighting of the shape series.
    • Support for some annotation layers for the shape series.

Infragistics Ultimate UI for WPF 21.2

$
0
0
Infragistics Ultimate UI for WPF

Adds support for .NET 6 and Visual Studio 2022.

Features

  • Added support for Microsoft Visual Studio 2022.
  • Added support for Microsoft .NET 6.0.
  • Category Chart, Financial Chart, Data Chart, and Geographic Map:
    • Added MarkerAutomaticBehavior that allows which marker type is assigned to multiple series in the same chart.
    • Added LegendItemBadgeShape for setting badge shape of all series represented in a legend.
    • Added LegendItemBadgeMode for setting badge complexity on all series in a legend.
  • Data Chart Series and Geographic Map Series:
    • Added LegendItemBadgeShape for setting badge shape on specific series represented in a legend.
    • Added LegendItemBadgeMode for setting badge complexity on specific series in a legend.
  • Category Chart and Financial Chart:
    • Added XAxisLabelLocation property to CategoryChart.
    • Added CrosshairsLineThickness and other properties for customizing crosshairs lines.
    • Added CrosshairsAnnotationXAxisBackground and other properties for customizing crosshairs annotations.
    • Added FinalValueAnnotationsBackground and other properties for customizing final value annotations.
    • Added AreaFillOpacity that allow changing opacity of series fill (e.g. Area chart).
    • Added MarkerThickness that allows changing thickness of markers.
  • Enhancements:
    • Simplified shapes of series in chart’s legend to display only circle, line, or square. This can be reverted by setting chart’s LegendItemBadgeMode property to MatchSeries enum value.
  • Geographic Map:
    • Added support for representing geographic series in a legend.

Infragistics Ultimate UI for WPF 22.1

$
0
0
Infragistics Ultimate UI for WPF

Adds Data Legend component and Data Tooltip annotation layer.

Features

  • Added new Data Legend component - The XamDataLegend is a new component that works much like the Legend component, but it shows the values of series and provides several configuration properties for filtering series rows and value columns, styling and formatting values. This legend updates when the mouse is moved inside the plot areas the various chart controls.
  • Added new Data Tooltip Layer - The DataToolTipLayer is a new annotation layer that displays the values and titles of series as well as legend badges in a tooltip.
    • It provides several configuration properties for filtering series rows and value columns, styling and formatting.
    • The tooltip's value updates when the mouse is moved inside the plot area of various chart controls.
    • The DataToolTipLayer is now the default tooltip type for each chart control.
  • Data Chart:
    • Added animation and transition-in support for Stacked Series. Animations can be enabled by setting the IsTransitionInEnabled property to true. From there, you can set the TransitionInDuration property to determine how long your animation should take to complete and the TransitionInMode to determine the type of animation that takes place.
  • Category Chart, Financial Chart, DataChart:
    • Added AssigningCategoryStyle event which is now available for all series in DataChart. This is used when you want to conditionally configure aspects of series items such as fill background-color or highlighting.
    • Added new AllowedPositions enumeration property to CalloutLayer. This is used to limit where callouts are to be placed within a chart.
    • Added new corner radius properties to Annotation Layers. These are used to round-out the corners of each callout.
    • Added new HorizontalViewScrollbarMode and VerticalViewScrollbarMode enumeration properties to enable scrollbars in various ways. When paired with IsVerticalZoomEnabled or IsHorizontalZoomEnabled, you'll be able to persist or fade-in and out scrollbars.
    • Added new FavorLabellingScaleEnd which determines whether an axis should favor emitting a label at the end of the scale.
    • Added new IsSplineShapePartOfRange which determines whether to include the spline shape in the axis range.
    • Added new XAxisMaximumGap which determines the maximum allowed value for the plotted series when using XAxisGap. The gap determines the amount of space between columns or bars of plotted series.
    • Added new XAxisMinimumGapSize which determines the minimum pixel-based value for the plotted series when using XAxisGap to ensure there is always spacing between each category.

Infragistics Ultimate UI for WPF 22.2

$
0
0
Sample chart

Improves Category Chart API and adds several new category axis properties.

Features

Chart Improvements

  • Added significant improvements to default behaviors and refined the Category Chart API to make it easier to use. These improvements include:
    • Responsive layouts for horizontal label rotation based on browser / screen size.
    • Enhanced rendering for rounded labels on all platforms.
    • Added marker properties to StackedFragmentSeries.
    • Added new ShouldPanOnMaximumZoom property.
  • Added new Category Axis Properties:
    • ZoomMaximumCategoryRange.
    • ZoomMaximumItemSpan.
    • ZoomToCategoryRange.
    • ZoomToItemSpan.
  • Added new Chart Aggregation API for Grouping, Sorting and Summarizing Category string and numeric values, eliminating the need to pre-aggregate or calculate chart data:
    • InitialSortDescriptions.
    • InitialSorts.
    • SortDescriptions.
    • InitialGroups.
    • InitialGroupDescriptions.
    • GroupDescriptions.
    • InitialSummaries.
    • InitialSummaryDescriptions.
    • SummaryDescriptions.
    • InitialGroupSortDescriptions.
    • GroupSorts.
    • GroupSortDescriptions.

Infragistics Ultimate updated

Infragistics Ultimate UI for WPF 23.1

$
0
0
Infragistics Ultimate UI for WPF

Adds new Toolbar component along with support for Chart Value Layer series.

Features

  • xamToolbar (Beta) - The xamToolbar component is a companion container for UI operations to interact on it's own, or with the Data Chart and CategoryChart components. This allows you to easily choose from a preset of properties on, for example, the XamDataChart with predefined SVG icons. It also gives you the ability to create custom tools for your project. Benefiting from a number of attributes, you can now define or change the icon in use or apply different actions to it. The Toolbar will display it's own SVG icons.
  • Chart Dash Array - Now supports the ability to apply a 'DashArray' to a series to visualize them as a dashed line. The dash array can also be applied to trendlines of the series via the TrendLineDashArray property. In addition, axes now support dash arrays for axis lines and major and minor gridlines.
  • Chart Value Layer - Added a new 'ValueLayer' series type which allows you to render an overlay for different focal points of plotted data including maximum, minimum and average. This is rendered as a dashed line in the plot area of the chart.

ComponentSource Partner Webinar - Infragistics

$
0
0
ComponentSource Partner Webinar - Infragistics

Your Infragistics Ultimate 17.1 Questions, Answered

Infragistics Ultimate 17.1 has a wealth of new features and updates. This webinar - recorded during the Ultimate 17.1 product launch - provides an in-depth look at many of those features.

What will you learn?

  • New for Mobile - Schedule UI, Sparkline, Grid Configurator
  • New for Web - Schedule UI, Excel Spreadsheet, React Components, Grid
  • New for Desktop - WPF & Windows Forms Enhancements
  • Prototyping and Usability Testing - Record / Playback Usability Study, Google Fonts in your prototypes
  • Embedded Analytics - ReportPlus Embedded SDK

Also included is a list of questions and answers from the webinar.

Click here to view the Q & A and to view the webinar recording.

15 WPF Performance Tips

$
0
0
15 WPF Performance Tips

Infragistics blog post for optimizing WPF applications.

Do your WPF apps suffer from poor performance? 

In this blog post, Brian Lagunas, Senior Product Owner for Infragistics, provides 15 tips to help you identify and improve the performance of your WPF applications.  Topics covered include:

  1. Identifying performance bottlenecks, such as broken bindings, complex layouts, lack of UI virtualization, etc.
  2. Establishing good coding practices, simplifing your Visual Tree, virtualizing your ItemsControls, and more.

View the blog post to read all 15 tips and have your WPF apps jumping into warp speed! 


Important Changes to the Infragistics Product Range

$
0
0

Find out about the Infragistics updates starting December 7, 2023.

Several Infragistics products have changed in price effective December 7, 2023. Infragistics Ultimate now includes App Builder - a cloud-based WYSIWYG tool designed to simplify user interface design and development. The new pricing for each product is shown below:

ProductUSD ($)EUR (€)GBP (£)
Indigo Design Essential *$495€435£385
Indigo.Design **$1,695€1,495£1,295
Infragistics Ignite UI$1,295€1,135£995
Infragistics Professional$1,495€1,315£1,155
Infragistics Ultimate$2,245€1,975£1,735
Infragistics Ultimate UI for ASP.NET Web Forms$1,595€1,395£1,225
Infragistics Ultimate UI for Windows Forms$1,195€1,055£925
Infragistics Ultimate UI for WPF$1,195€1,055£925
Infragistics Windows Forms Test Automation for IBM ***$2,995€2,635£2,295
Infragistics Windows Forms Test Automation for Micro Focus UFT ***$2,995€2,635£2,295
Infragistics WPF Test Automation for Micro Focus UFT ***$2,995€2,635£2,295

Log on to ComponentSource and visit the links above to see your personalized discounted prices in your local currency.

Prices shown are SRP for 1 Seat New Perpetual Licence with 1 year Standard Support subscription except:
* 1 Year Annual Subscription License with Professional Support
** 1 Year Annual Subscription License with Enterprise Support
*** Includes Priority Support

Build Rich UIs for Desktop and Web with .NET 8

$
0
0

Infragistics .NET 8 support empowers developers to seamlessly integrate their UI expertise into cutting-edge .NET applications.

Infragistics Ultimate is a comprehensive toolkit designed to streamline UX/UI creation and development across desktop, web, and mobile platforms. It offers hundreds of pre-built, high-performance UI components like grids and charts, alongside design-to-code tools for rapid prototyping, user testing, and even code generation. This enables developers and designers to create visually appealing and interactive applications faster, while its support for various frameworks and platforms ensures flexibility.

Infragistics Ultimate UI for Windows Forms, Ultimate UI for WPF and Ignite UI for Blazor now support .NET 8. This allows developers to benefit from the performance improvements, cross-platform compatibility, and new APIs in the latest version of Microsoft's leading development framework.

Infragistics Ultimate UI for Windows Forms, Ultimate UI for WPF and Ignite UI for Blazor are licensed per developer and are available as a Perpetual License with 1, 2 or 3 year support and maintenance subscription. See our Infragistics Ultimate UI for Windows Forms, Ultimate UI for WPF and Ignite UI for Blazor licensing pages for full details.

For more information please visit our product pages:

The following product suites also include Infragistics Windows Forms, WPF and Ignite UI:

Emphasize Specific Sections of a Funnel Chart

$
0
0

Infragistics Ultimate UI for Windows Forms and WPF gain a new overlay feature to help users identify areas that deviate from the overall trend.

Infragistics Ultimate UI for Windows Forms and Infragistics Ultimate UI for WPF are comprehensive suites of UI controls designed to streamline development and enhance the user experience of desktop applications. Boasting over 100 components, they offer a rich set of functionalities, including data visualization tools, high-performance grids, and modern UI elements that mimic the look and feel of Microsoft Office. These feature-packed libraries empower developers to craft powerful, visually appealing applications with a consistent user experience.

In the latest version, funnel charts can now display a special overlay to highlight specific sections. This highlighting feature allows you to compare the values of different stages in your funnel. You can also control the transparency of the overlay to emphasize the difference between the main data and the highlighted data.

To see a full list of what's new, see our release notes for Infragistics Ultimate UI for Windows Forms and a href="https://www.componentsource.com/product/infragistics-wpf/releases/2834061?utm_source=newsitem&utm_medium=rss&utm_campaign=cs_en_rss_2832441">Infragistics Ultimate UI for WPF.

Infragistics Ultimate UI for Windows Forms and Infragistics Ultimate UI for WPF are licensed per developer and are available as a Perpetual License with 1, 2 or 3 year support and maintenance subscription. See our Infragistics Ultimate UI for Windows Forms licensing page or Infragistics Ultimate UI for WPF licensing page for full details.

Infragistics Ultimate UI for Windows Forms is available to buy in the following products:

Infragistics Ultimate UI for WPF is available to buy in the following products:

Improve Chart Interactivity with Series Selection

$
0
0

Infragistics Ultimate UI for WPF 24.1 helps uncover insights and enhance user experiences with customizable chart series selection.

Infragistics Ultimate UI for WPF is a comprehensive suite of UI controls designed to streamline development and enhance the user experience of desktop applications. Boasting over 100 components, it offers a rich set of functionalities, including data visualization tools, high-performance grids, and modern UI elements that mimic the look and feel of Microsoft Office. These feature-packed libraries empower developers to craft powerful, visually appealing applications with a consistent user experience.

The Infragistics Ultimate UI for WPF 24.1 release offers enhanced chart interactivity with the new series selection feature. Applicable to category, financial, and radial charts, this feature allows users to select individual series and visually differentiate them using color changes or adding focus outlines. Developers have granular control over selection behavior, choosing to affect entire series or specific data items, and can manage multiple selections simultaneously. This functionality proves invaluable for highlighting data patterns and trends, facilitating comparisons between data points.

To see a full list of what's new in 24.1, see our release notes for Infragistics Ultimate UI for WPF.

Infragistics Ultimate UI for WPF is licensed per developer and is available as a Perpetual License with 1, 2 or 3 year support and maintenance subscription. See our Infragistics Ultimate UI for WPF licensing page for full details.

Infragistics Ultimate UI for WPF is available to buy in the following products:

Create Modern Apps Faster with .NET 9 Features

$
0
0

Infragistics now supports .NET 9, offering enhanced performance and new capabilities to streamline app development and design workflows.

Infragistics Ultimate is a comprehensive toolkit designed to streamline UX/UI creation and development across desktop, web, and mobile platforms. It offers hundreds of pre-built, high-performance UI components like grids and charts, alongside design-to-code tools for rapid prototyping, user testing, and even code generation. This enables developers and designers to create visually appealing and interactive applications faster, while its support for various frameworks and platforms ensures flexibility.

Infragistics Ultimate UI for Windows Forms, Ultimate UI for WPF and Ignite UI for Blazor now support .NET 9. By embracing the latest version of Microsoft's popular framework, developers gain access to the most up-to-date language features, performance enhancements, and improved tooling provided by .NET 9. This ensures that applications built with Infragistics components are modern, efficient, and leverage the latest innovations in the .NET ecosystem.

Infragistics Ultimate UI for Windows Forms, Ultimate UI for WPF and Ignite UI for Blazor are licensed per developer and are available as a Perpetual License with 1, 2 or 3 year support and maintenance subscription. See our Infragistics Ultimate UI for Windows Forms, Ultimate UI for WPF and Ignite UI licensing pages for full details.

For more information please visit our product pages:

Infragistics Windows Forms, WPF and Ignite UI are also available in the following product suites:
Viewing all 73 articles
Browse latest View live


<script src="https://jsc.adskeeper.com/r/s/rssing.com.1596347.js" async> </script>